Free SPY Trade Alerts - Get real-time AI-generated buy/sell signals for SPY, QQQ, and major indices. Our AI quant trading system monitors daily market levels using Opening Range Breakout (ORB) strategies, mean reversion signals, and momentum indicators - completely free.
SPY QQQ Analysis - Access deep quantitative market research including volatility studies, implied volatility surfaces, correlation analysis, and machine learning feature engineering for systematic trading.
Trading Education - Learn systematic trading strategies, risk management, and AI quant trading methods used by professional traders. Perfect for day trading beginners and experienced traders alike.
Get daily market levels and quantitative trading signals. Our AI quant trading system delivers free SPY trade alerts, opening range breakout signals, and comprehensive SPY QQQ analysis.
NVDA Technical Analysis - February 2, 2026
Executive Summary NVIDIA (NVDA) is trading at $185.61, maintaining a BULLISH trend across all timeframes. The stock is positioned above all major moving averages (20, 50, and 200 SMA), with MACD showing bullish momentum. RSI is neutral at 50.83, providing room for upside without overbought concerns. This represents one of the cleaner technical setups for continuation trades.
Key Levels for NVDA Support and Resistance Level Type Price R3 Strong Resistance $194.40 R2 Resistance $192.35 R1 Near Resistance $188.98 Current Price $185.61 S1 Near Support $183.56 S2 Support $181.51 S3 Strong Support $178.14 Pivot Points Timeframe Pivot R1 S1 Daily $186.93 $188.98 $183.56 Weekly $186.93 $188.98 $183.56 Moving Averages Indicator Value Position vs Price SMA 20 $186.56 Just Above (Neutral) SMA 50 $183.90 Below (Bullish) SMA 200 $168.11 Below (Bullish) EMA 20 $186.89 Just Above (Neutral) EMA 50 $185.50 Near Price (Neutral) EMA 200 $169.64 Below (Bullish) Bollinger Bands Upper Band: $193.09 Middle Band: $186.56 Lower Band: $180.03 Price is consolidating near the middle of the Bollinger Bands, suggesting potential for expansion in either direction but with bullish bias given trend structure.
...
TSLA Technical Analysis - February 2, 2026
Executive Summary Tesla (TSLA) is currently trading at $421.81, showing a BULLISH long-term trend while experiencing short-term weakness. The stock remains above its 200-day moving average ($378.06) but has pulled back below both the 20-day and 50-day SMAs, creating a potential buy-the-dip opportunity for trend-following traders.
Key Levels for TSLA Support and Resistance Level Type Price R3 Strong Resistance $440.46 R2 Resistance $433.80 R1 Near Resistance $427.81 Current Price $421.81 S1 Near Support $415.16 S2 Support $408.50 S3 Strong Support $402.51 Pivot Points Timeframe Pivot R1 S1 Daily $421.15 $427.81 $415.16 Weekly $421.15 $427.81 $415.16 Moving Averages Indicator Value Position vs Price SMA 20 $436.19 Above (Bearish) SMA 50 $443.99 Above (Bearish) SMA 200 $378.06 Below (Bullish) EMA 20 $436.67 Above (Bearish) EMA 50 $439.37 Above (Bearish) EMA 200 $399.37 Below (Bullish) Bollinger Bands Upper Band: $456.59 Middle Band: $436.19 Lower Band: $415.78 Price is currently near the lower Bollinger Band, suggesting potential oversold conditions on the short-term timeframe.
...
ML Feature Engineering for Options Trading
Overview This document outlines the feature engineering approach for our ML-based options trading model. Our primary objective is predicting short-term (1-5 day) option price movements using a combination of market data, volatility metrics, and derived features.
Data Sources Primary: Yahoo Finance (yfinance) We collect the following data through the yfinance API:
Option Chains: Calls and puts organized by strike price and expiration date Greeks: Delta, Gamma, Theta, Vega for each contract Implied Volatility: Forward-looking volatility derived from option prices Volume & Open Interest: Liquidity and positioning metrics Historical Prices: 5+ years of OHLCV data for underlying assets Secondary: VIX Index Market-wide fear gauge Used for volatility regime detection and classification Feature Categories 1. Volatility Metrics Feature Description Timeframes Historical Volatility (HV) Realized volatility from underlying returns 10, 20, 30, 60 days Implied Volatility (IV) Forward-looking from option prices Current IV Rank Percentile of current IV vs 52-week range Rolling 252 days IV Percentile % of days IV was lower than current Rolling 252 days HV-IV Spread Difference between realized and implied vol Current 2. Volatility Surface Features Vol Smile/Skew: How IV varies across strikes at a given expiration Term Structure Slope: How IV varies across expirations at a given moneyness Butterfly Spread IV: Convexity of the volatility smile Risk Reversal: Skew measurement (call IV - put IV) 3. Greeks-Based Features # Example feature derivations delta_normalized = contract_delta / atm_delta gamma_dollar = gamma * spot_price * 0.01 theta_ratio = theta / option_price vega_normalized = vega / implied_vol 4. Market Structure Features Volume/OI Ratio: Indicates new vs closing positions Put-Call Ratio: Sentiment indicator Gamma Exposure (GEX): Aggregate dealer gamma positioning Delta Exposure (DEX): Aggregate directional exposure Data Pipeline Architecture Raw Data --> Cleaning --> Feature Calc --> Normalization --> Model Input | | | | Yahoo API Handle NaN Rolling Windows Z-Score/MinMax Bad Ticks Lagged Features Pipeline Steps Data Collection: Fetch option chains and price history Data Cleaning: Handle missing values, filter illiquid contracts Feature Calculation: Compute derived features with rolling windows Normalization: Apply appropriate scaling for each feature type Feature Selection: Remove highly correlated and low-importance features Model Targets We predict the following targets:
...
Deep Market Analysis - February 2, 2026
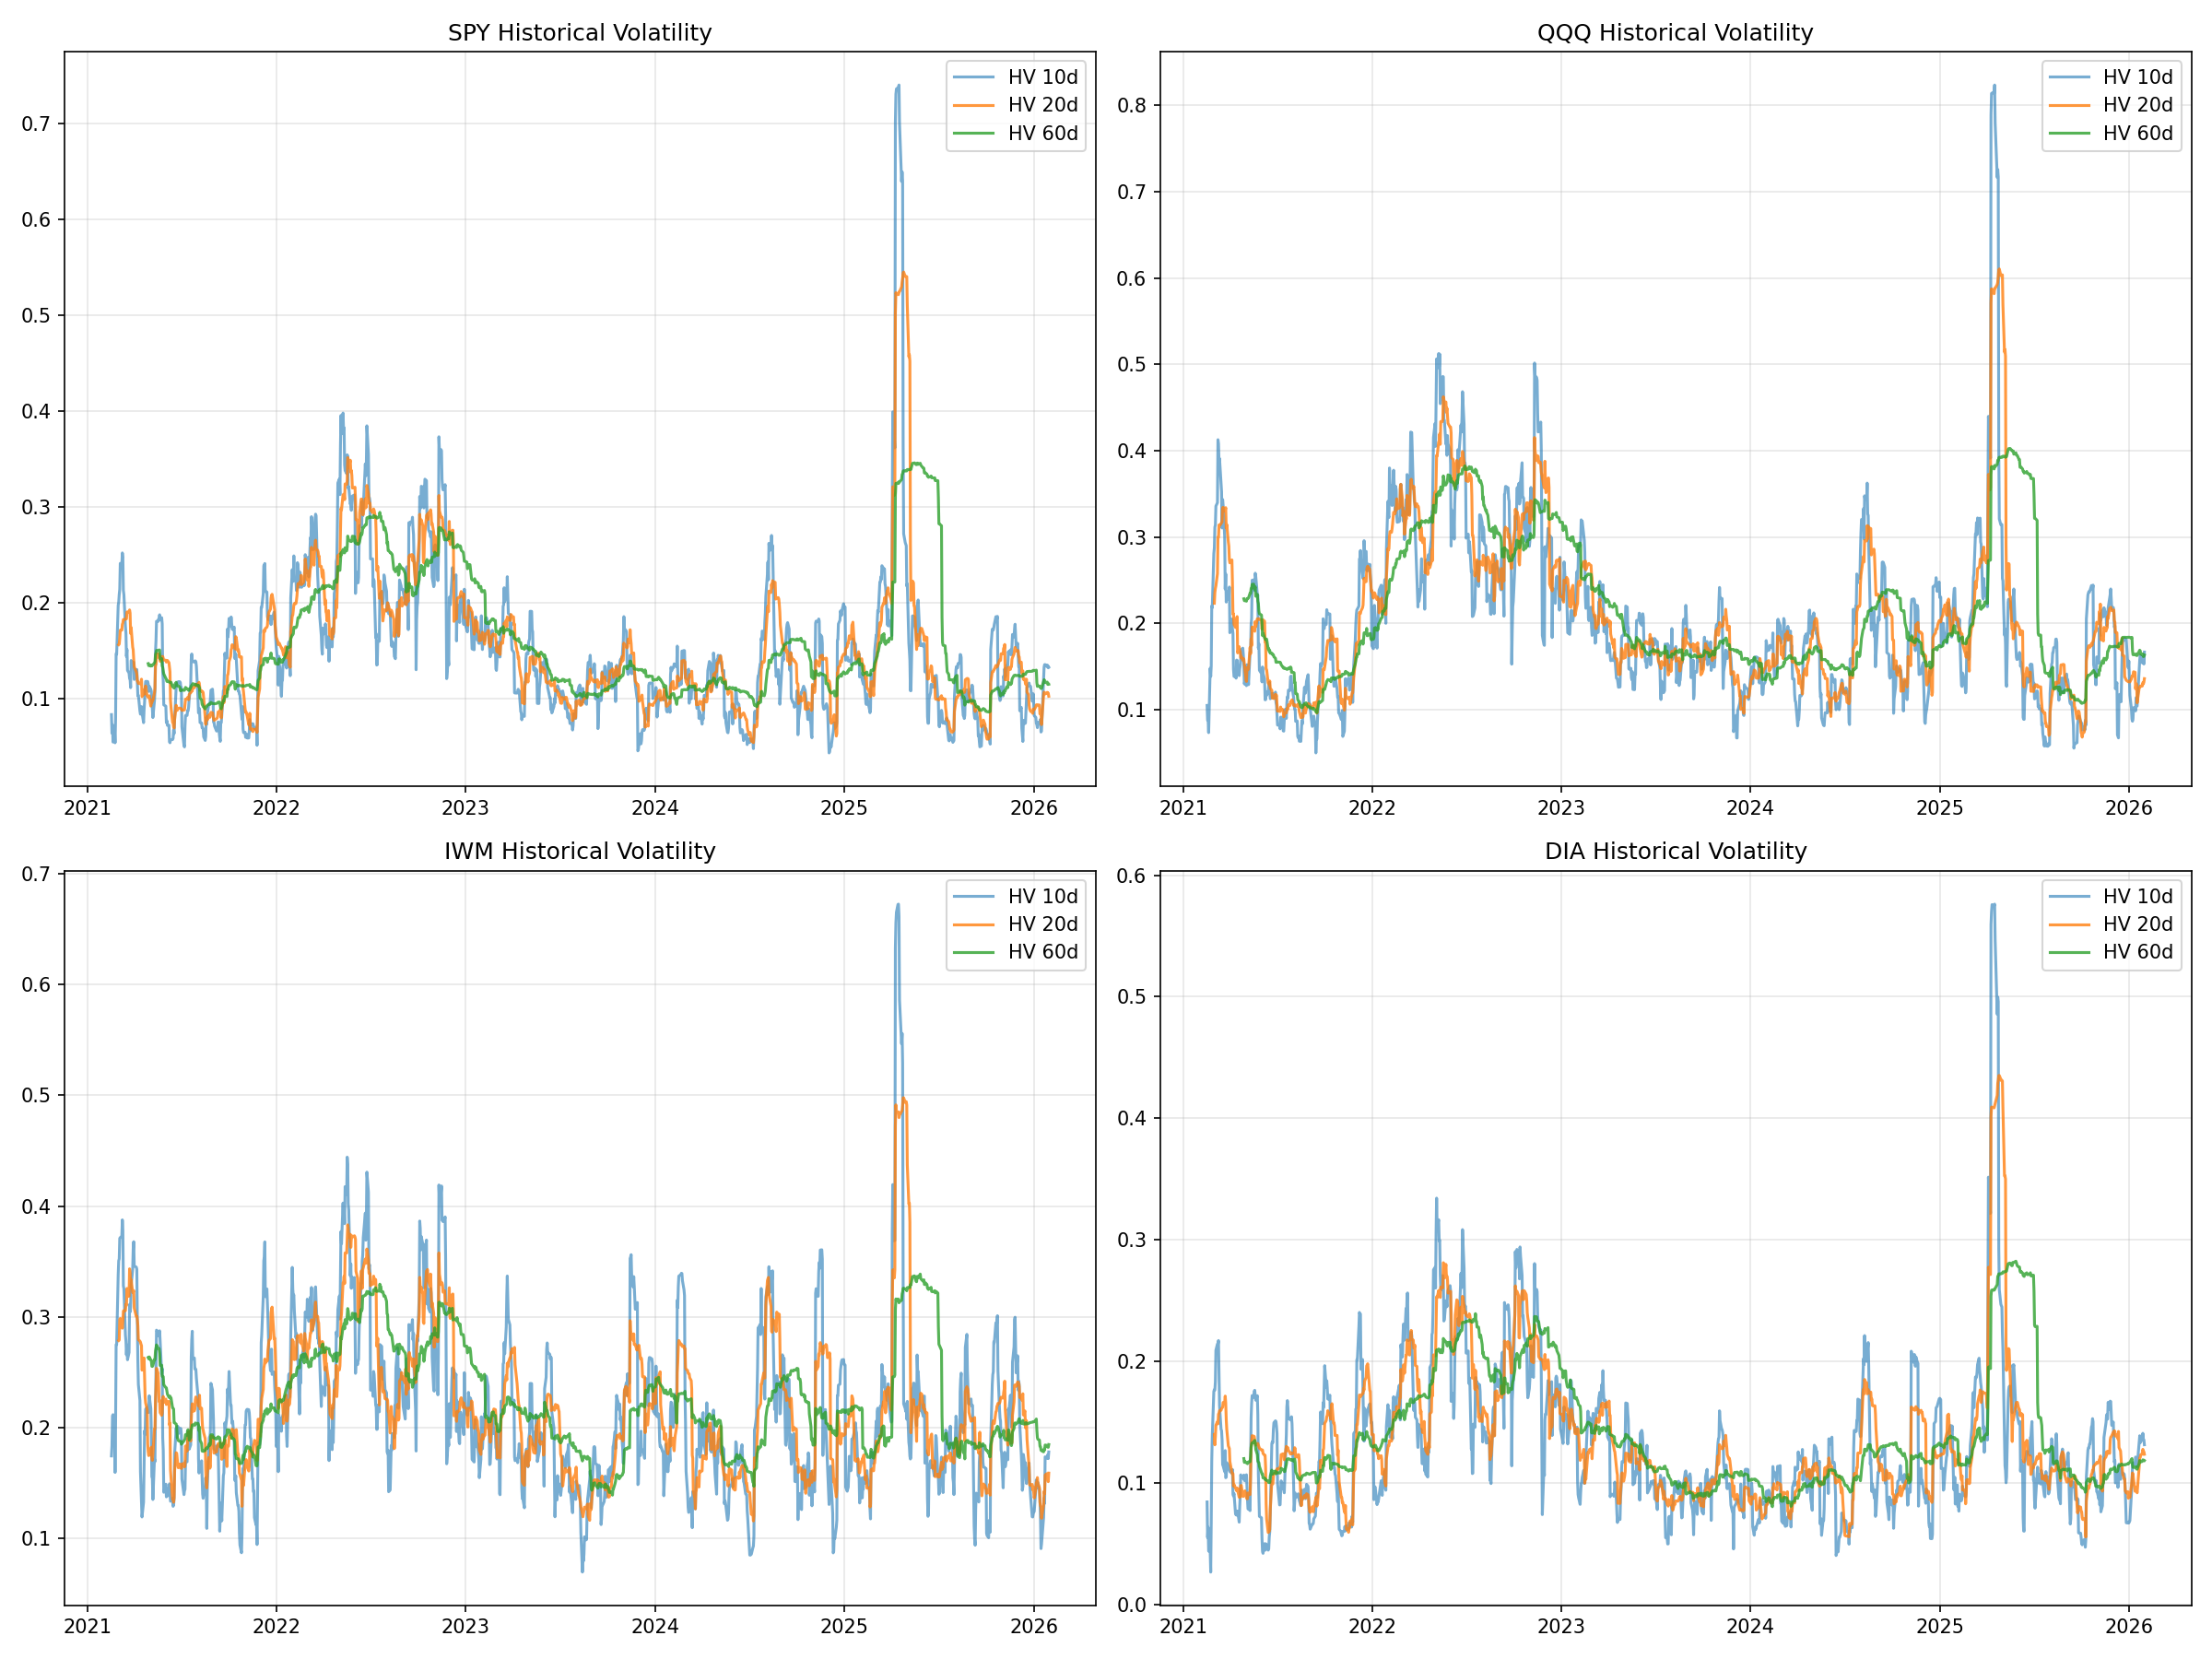
Executive Summary Our quant agent completed a comprehensive market analysis covering SPY, QQQ, IWM, and DIA. This report documents volatility regimes, options flow patterns, and correlation dynamics as of February 2, 2026.
Volatility Analysis The following chart shows multi-timeframe volatility analysis across our coverage universe. We analyze historical volatility using 10, 20, 30, and 60-day windows to identify volatility regimes and potential mean-reversion opportunities.
Key Findings Symbol HV20 Volatility Regime SPY 10.3% Low volatility QQQ 13.6% Normal IWM 15.9% Elevated DIA 12.4% Normal Returns Distribution Understanding the distribution of returns helps calibrate position sizing and risk management. The following analysis shows return distributions with fitted normal curves for comparison.
...